I am a great admirer of the work of Bruce Dawson on Event Tracing for Windows, UIforETW and his blog posts on using ETW to track down all sorts of weird and wonderful issues.
I also found Bruce’s training videos on the subject, despite the videos knocking on the door of being a decade old, to be very useful.
I was delighted to have a recent opportunity to practise my own skills in this area, following Bruce’s lead!
The Symptom
The end user was experiencing delays of between several seconds and about half a minute when saving comments in a Word document. Choosing to Insert the comment was fine and when typing the comment, Word also behaved normally. Press Save, however, and Word’s UI would hang for somewhere between a few and 30 seconds.
Yep, sometimes half a minute for each comment being saved!
In a document that required a lot of comments, this was dramatically slowing the user’s work.
Gathering a Trace
I transferred UIforETW onto the target system, ran it with its defaults and did Start Trace.
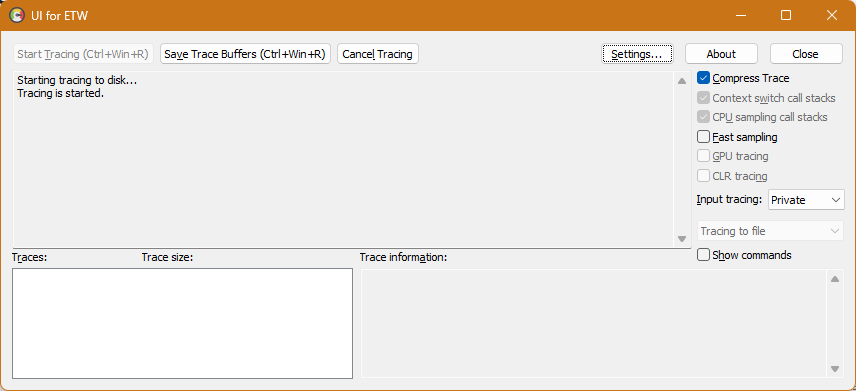
We then opened the document, made a new comment in Word and pressed the Save button. The delay of a few seconds (a short delay, this time!) was present.
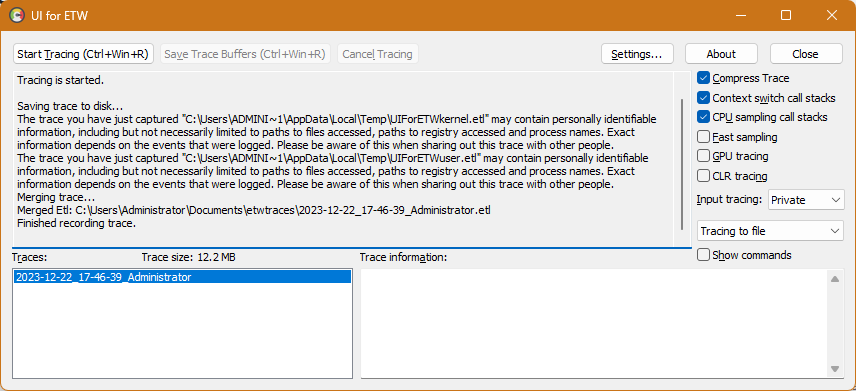
Now I pressed Saved Trace Buffers and transferred the files to my analysis machine.
Analysis
The analysis machine has Windows Performance Analyzer installed as part of the Windows Performance Toolkit available in the Windows SDK.
The first step for a successful analysis is to load symbols. Without symbols, we will have no fun at all identifying what the app is actually doing when the interface stops responding, as we won’t see the function names that are being called.
I already had the environment variable _NT_SYMBOL_PATH set globally:
srv*C:\symbols*https://msdl.microsoft.com/download/symbolsSo, in Windows Performance Analyzer, I clicked Trace > Load Symbols and sat back for a while. It took a few minutes to gather symbols for the entire trace.
Narrowing it down
As Bruce suggests, a great rule of thumb in this scenario for narrowing down the trace to only the area of interest is to look at Window in Focus. When the focus transfers to dwm.exe (the window compositor), the app has been failing to pump messages from the message queue for roughly 5 seconds. (This transfer to dwm corresponds with the first moment that the end user will notice “not responding” being displayed in the title bar of the offending window.)
I dragged across the target graph area — about 5 seconds before dwm takes focus — right-clicked and chose Zoom.
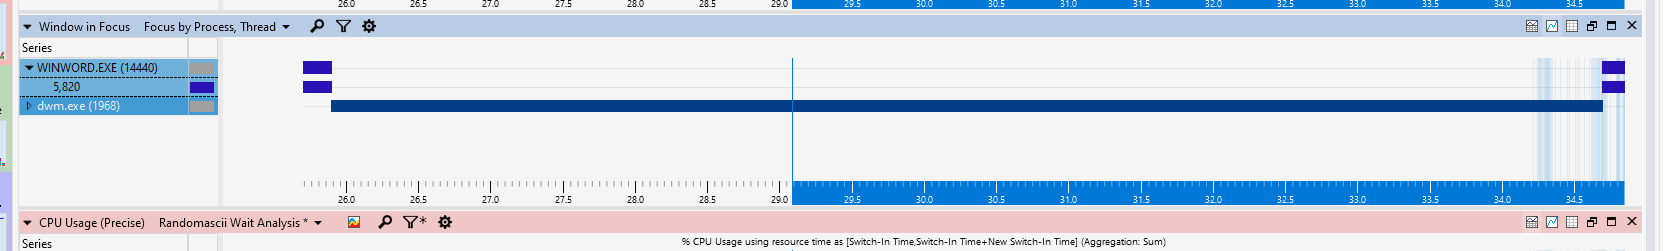
Before switching contexts to find out where WINWORD is spending its time, I expanded the WINWORD node and took note of its thread ID: 5820.
What’s taking the time?
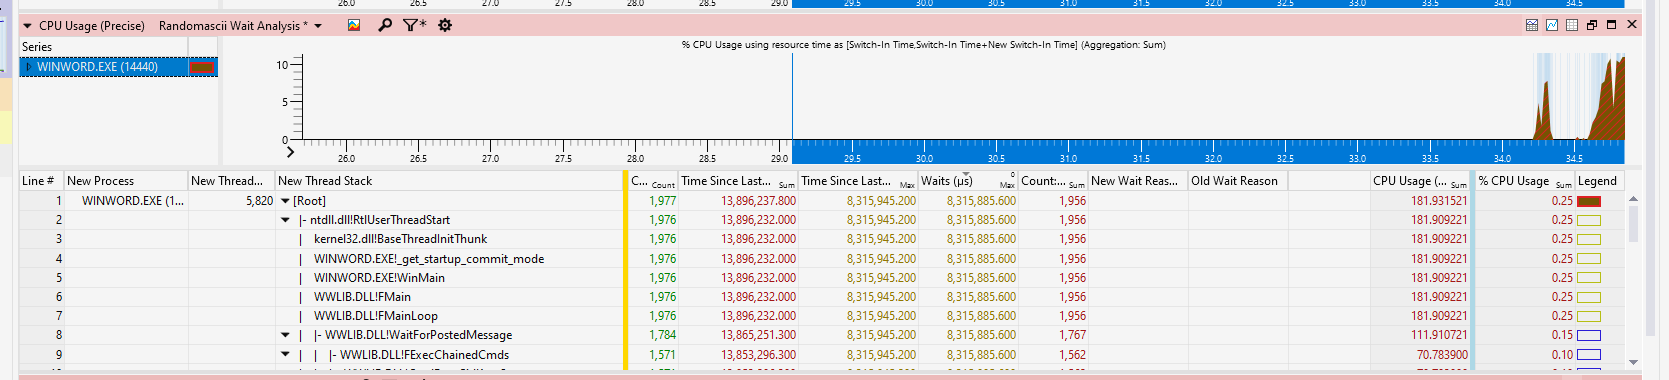
Now I headed to the CPU Usage (Precise) view and used the Filter (funnel icon) to only show thread ID 5820. Since I allowed UIforETW to install Bruce’s custom workspace bits and pieces, we’re using the Randomascii Wait Analysis view.
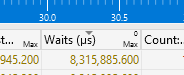
The key here was to sort by Waits (µs) and start digging down in the New Thread Stack column.
We’re looking at a wait time of ~8,315,945 µs here, or about 8 seconds, to save the comment and for Word to become responsive again.
Thankfully, Microsoft now seem to publish symbols for Office apps, which I do not believe they used to do. Without them, we’d be missing function names in the New Thread Stack column, giving us many fewer clues as to what is going on.
When you have dug down far enough through these stacks, suddenly the wait time in the Waits column will drop dramatically. This is critical to notice: it means that the waiting time is no longer being spent in a sub-call; the time is being spent directly in the last function with the large wait time.
Eventually, I dug down far enough to find something rather suspicious: WWLIB.DLL!FConnectPrinterCore. (Interestingly, further up the stack is a call to HRenderOleMetafilePrintCore – perhaps this is related to rendering a WMF image in the document template?)
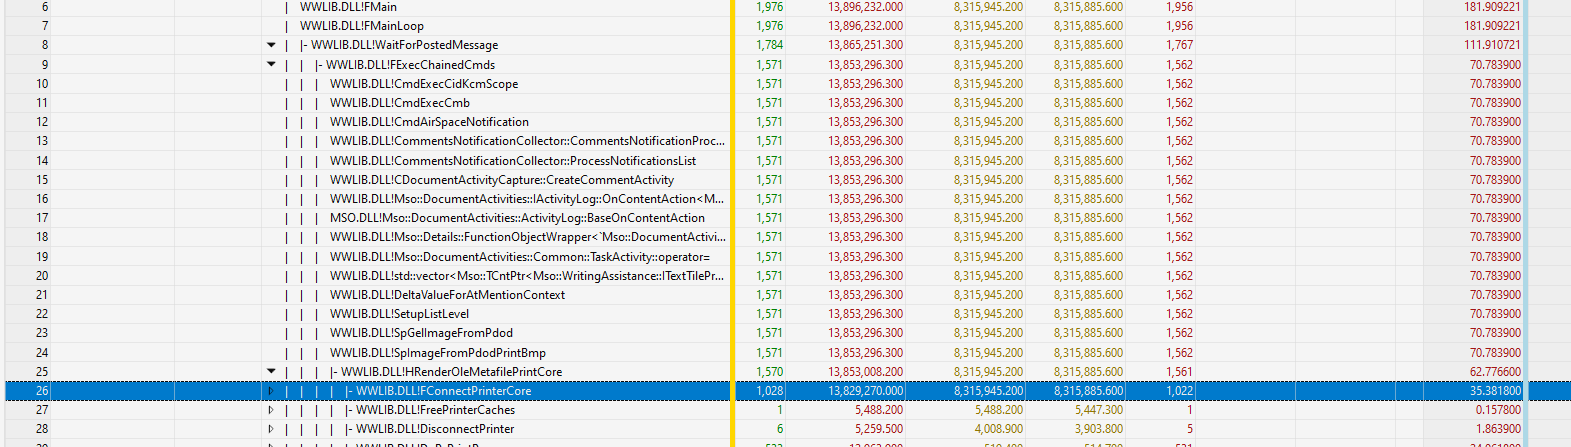
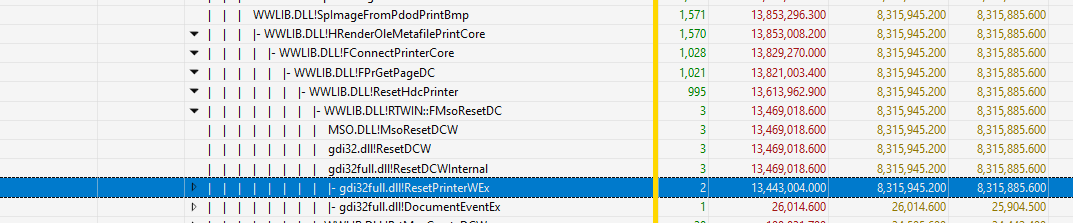
I dug a few levels deeper, and it was trying to call gdifull32.dll!ResetPrinterWEx. Every time we saved a comment.
ResetPrinterWEx’s call to DocumentEventEx takes only ~26,000 µs, so the overwhelming majority of the ~8 million µs is being spent directly in ResetPrinterWEx. It is the culprit.
Microsoft’s documentation on ResetPrinter reveals Microsoft haven’t followed their own advice in this case:
This is a blocking or synchronous function and might not return immediately. How quickly this function returns depends on run-time factors such as network status, print server configuration, and printer driver implementation factors that are difficult to predict when writing an application. Calling this function from a thread that manages interaction with the user interface could make the application appear to be unresponsive.
This is definitely being called from a thread that manages interaction with the user interface!
The Solution
So, my adventure in ETW revealed that this is something to do with printers. We try and interact with the printer every time we save a comment in Word. If that process is slow, Word will lock up the UI thread for the duration.
I investigated the user’s printers, and identified an out-of-date reference to a network printer, which was the user’s default printer.
In this case, the time taken to attempt to communicate with the printer over a slow network link explained the delay, and indeed why sometimes the delay was much longer than at other times.
I corrected the user’s default printer reference and the issue went away!
Conclusion
I really love getting deep like this.
This is the kind of thing that is difficult to pin down without everything coming together: the tools, the training and the reproducibility of the issue, so we can capture a trace when it’s actually misbehaving!